
KDI FOCUS Policy Agenda for Effecive Expansion of Renewable Energy Deployment July 27, 2026
Policy Agenda for Effecive Expansion of Renewable Energy Deployment
July 27, 2026-
Heehyun Lim
 프로필
프로필
-
Sunghoon Chung
 프로필
프로필


Greater urgency in renewable expansion has driven a corresponding rise in the cost of policy incentives. Can the rollout be accelerated while enhancing policy efficiency? This analysis finds that the current RPS-REC scheme clears only a baseline cost-benefit test, leaving room for improvement. Interlocking bottlenecks in grid connection and financing slow renewable deployment and risk eroding the cost-effectiveness of subsidies. Achieving both speed and efficiency will require coordinated progress on three fronts: rationalizing subsidy design, expanding grid infrastructure, and improving financing conditions.
I. Background
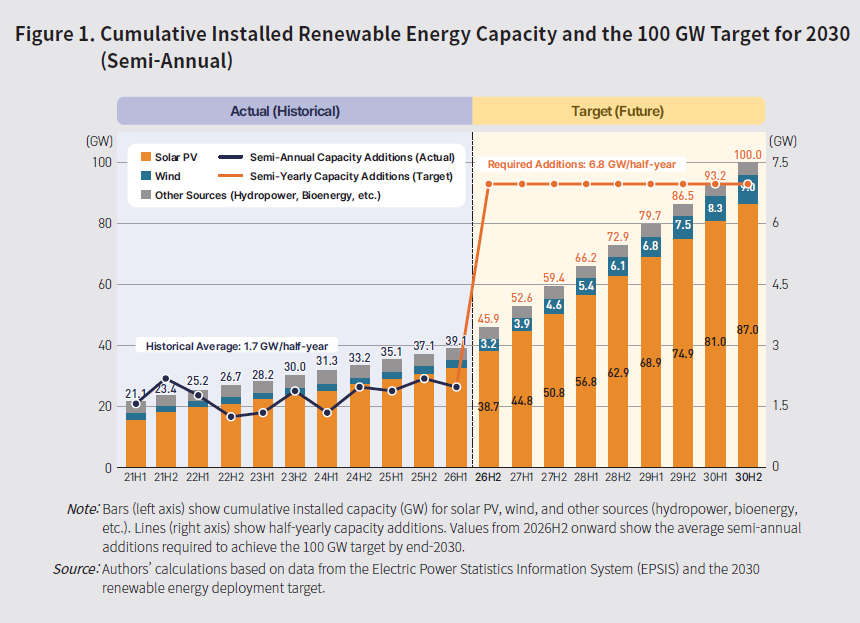
Investment in advanced industries such as semiconductors and AI data centers is expanding, and global carbon-neutrality norms are shifting from principle to practice. Together, these drivers have elevated renewable energy deployment to a matter of national competitiveness and economic security. In response, the Korean government has set a target of 100 GW of cumulative installed renewable capacity by 2030— 87 GW of solar photovoltaic (PV), 9 GW of wind, and 4 GW from other sources. As Figure 1 shows, however, cumulative installed capacity reached only 39.1 GW in the first half of 2026. Meeting the 2030 target will require adding an average of at least 6.8 GW every half-year. This is four times the 1.7 GW semi-annual average over the past 5.5 years, with solar PV needing to expand roughly 3.6 times faster and wind 10 times faster.
Achieving the 100 GW renewable target by 2030 requires a fourfold acceleration in the pace of deployment.
Moreover, progress to date has relied heavily on substantial government subsidies. Take expenditure under the Renewable Portfolio Standard (RPS), the principal scheme supporting renewable deployment today: it reached 4.5 trillion won in 2025 alone, bringing the cumulative amount since its 2012 inception to approximately 28 trillion won. These costs are collected through a line item on consumer electricity bills and so bear directly on public welfare. If the social costs of these subsidies outweigh their returns, the scheme loses its rationale for scaling up deployment.
The sharp rise in subsidy spending underscores the need to assess its cost-effectiveness.
This study explores how Korea can meet the twin objectives of rapidly expanding renewable energy deployment while improving the cost-effectiveness of the subsidies supporting that growth. It focuses specifically on how subsidy designs that strengthen economic incentives for renewable power producers interact with measures to address the key structural bottlenecks to deployment, drawing out actionable policy implications.
This study explores ways to rapidly expand renewable energy deployment while improving the cost-effectiveness of subsidies.
II. Cost–Benefit Analysis of Renewable Energy Subsidies
Before turning to the analysis, consider the renewable energy deployment process outlined in Figure 2. As the primary actors in deployment, renewable power producers generate revenue only after installing generation facilities and transmitting electricity through the power grid. The policy frameworks and operating conditions the government puts in place at each stage therefore weigh heavily on their decisions.
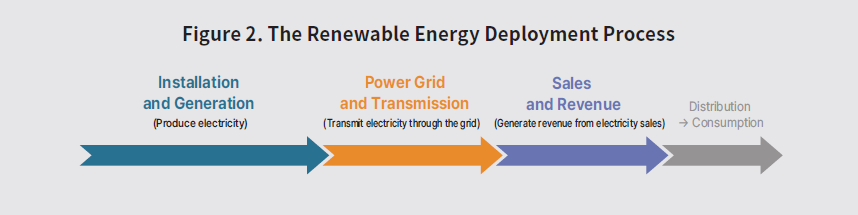
The RPS provides subsidies at the sales and revenue stage to encourage deployment. Large power producers are required to source a specified share of their total generation from new and renewable energy sources, meeting the quota either by generating renewable electricity themselves or by purchasing Renewable Energy Certificates (RECs). Korea Electric Power Corporation (KEPCO) then reimburses the associated compliance costs. The additional revenue from REC sales enhances incentives for power producers to expand capacity. What remains unclear, however, is how much benefit this additional deployment actually delivers to consumers who ultimately bear the subsidy costs.
By providing REC sales revenue in addition to electricity generation revenue, the current scheme strengthens incentives for power producers to expand renewable capacity.
This study evaluates the cost-effectiveness of the RPS-REC system by measuring the social benefit generated per additional won of subsidy expenditure. Under conservative scenarios and parameters using 2020 data, Table 1 shows that the estimated social benefit per won of subsidy is 1.33 won for solar PV and 1.18 won for onshore wind. Because social benefits exceed costs for both technologies, the system passes a basic social cost–benefit test.
For both solar PV and wind, social benefits exceed subsidy costs (over 1 won per won spent), indicating that the system passes a basic cost–benefit test.
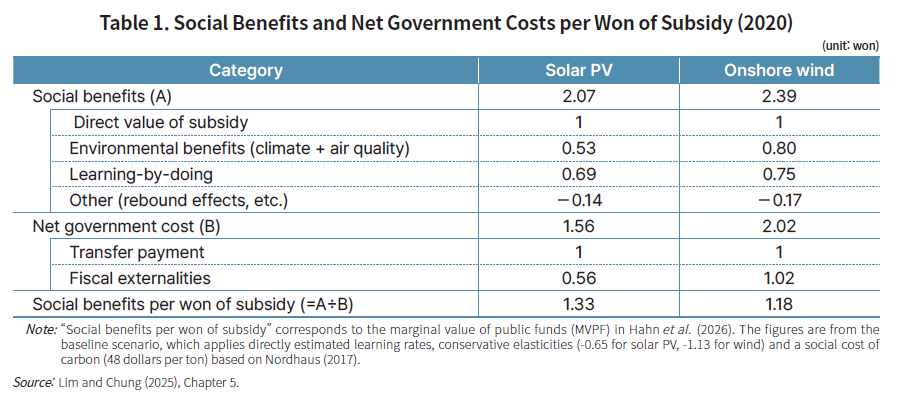
Specifically, the components of social benefits (A) in Table 1 break down as follows. The primary component is the direct value accruing to the power producers receiving the subsidy, valued at 1 won. Added to this is the value of damages avoided when renewable generation displaces fossil-fuel-based power. Each kilowatt-hour (kWh) of coal- or gas-fired power displaced cuts emissions of carbon dioxide (climate damage) as well as fine particulate matter and sulfur oxides (health damage). Monetizing these avoided damages yields environmental benefits, which are 0.53 won for solar PV and 0.80 won for wind. Installing more capacity also builds practical know-how that lowers the cost of subsequent installations—so-called learning-by-doing—and generates future benefits worth 0.69 won for solar PV and 0.75 won for wind. After netting out rebound effects and other factors (Other), where lower electricity prices stimulate consumption and partially offset the environmental gains, total social benefits amount to 2.07 won for solar PV and 2.39 won for wind.
Social benefits arise mainly from lower carbon emissions, improved air quality, and reduced generation costs as cumulative installed capacity increases (learning-by-doing).
Next, consider net government cost (B). An additional won of subsidy extends beyond a direct transfer payment of 1 won. Higher subsidies induce power producers to invest more, and the additional capacity that results is itself eligible for subsidies, compounding the fiscal burden. This additional burden is a fiscal externality. In Korea, this effect is particularly strong because facilities remain eligible for REC issuance as long as they produce and supply power. For wind, the fiscal externality amounts to 1.02 won, so each won of subsidy costs 2.02 won in total, borne ultimately by electricity consumers. Even solar PV, whose lower per-unit subsidy is not subject to the 1.2 multiplier applied to wind, adds a fiscal externality of 0.56 won, bringing its net cost to 1.56 won. All in all, the difference in benefit per won of subsidy between the two technologies (1.33 won for solar PV versus 1.18 won for wind) stems mainly from the gap in net government cost rather than from the benefits themselves.
Rising REC prices risk eroding estimated subsidy benefits, underscoring the need to enhance cost-effectiveness.
These results alone do not demonstrate that the current subsidy system is sufficiently cost-effective. The estimates of 1.33 won and 1.18 won are only for 2020 and not fixed values. A rise in REC prices would increase net government costs and, thereby, reduce the benefit per won. They also sit well below the US estimates for the same year obtained using the same methodology—3.50 for solar PV and 5.21 for wind. Taken together, it is reasonable to view the RPS-REC subsidy as clearing the cost-benefit test only narrowly, which makes it worth examining the factors that determine the values in Table 1 and identifying ways to raise benefits and lower costs.
Designing subsidies to deliver stable and predictable revenues encourages large-scale capacity expansion, strengthening learning effects and improving subsidy cost-effectiveness.
Two factors weigh heavily on the benefit generated per won of subsidy: learning-by-doing and supply elasticity. Learning-by-doing is pivotal to the success of the current scheme—excluding it from the estimates in Table 1 lowers the benefit per won to 0.89 won for solar PV and 0.80 won for wind. Roughly one-third of the estimated benefits for each generation technology comes from future cost reductions. The analysis also finds that these effects are stronger when power generation revenues are stable and predictable. One explanation is that predictable revenue streams lower investment risk and enable power producers to expand capacity on a scale that yields greater cost reductions. Designing the subsidy system to provide revenue certainty is therefore one way to meaningfully improve its cost-effectiveness.
Supply elasticity captures the sensitivity of investment to price changes among power producers. The greater this responsiveness, the more investment in new capacity a given subsidy induces. The resulting capacity expansion strengthens learning effects and further lowers installation costs, creating a virtuous cycle. Table 1 assumes a conservative, low-elasticity scenario. Raising elasticity to the high level in Table 2 increases the estimated benefit per won to 3.84 won for solar PV and 1.57 won for wind. The key question is whether supply elasticity can in fact be raised. Figure 2 shows that power producers adjust their investments based on conditions at each stage of the deployment process. Difficulty securing finance at the installation stage or congestion constraints at the power grid stage inevitably weaken their responsiveness to subsidies. Conversely, improving the institutional and physical conditions at each stage can increase supply elasticity.
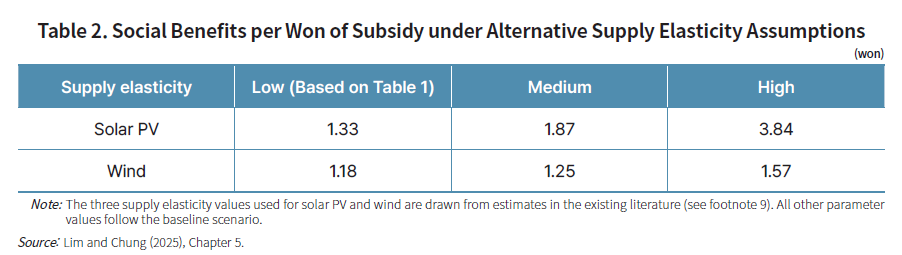
Easing institutional constraints on investment enables power producers to respond more sensitively to price signals, increasing the effectiveness of subsidies.
In short, the RPS-REC subsidy returns more than 1 won in social benefit for every won spent, confirming its economic rationale. Yet it falls short of being sufficiently cost-effective. Without learning-by-doing, benefits would drop below the break-even threshold, and the current returns remain far below the US estimates. The leverage point is that these values are not static, leaving room for policy maneuver. By anchoring the subsidy framework in long-term revenue certainty and creating conditions that enable producers to respond dynamically to price signals, a virtuous cycle of learning-by-doing and supply elasticity can be unlocked, driving subsidy efficiency beyond current levels.
III. Structural Constraints on Renewable Deployment
The analysis now focuses on expanding renewable energy deployment. Using cross-country panel data, this study identifies key drivers beyond generation costs and evaluates Korea’s conditions for each.
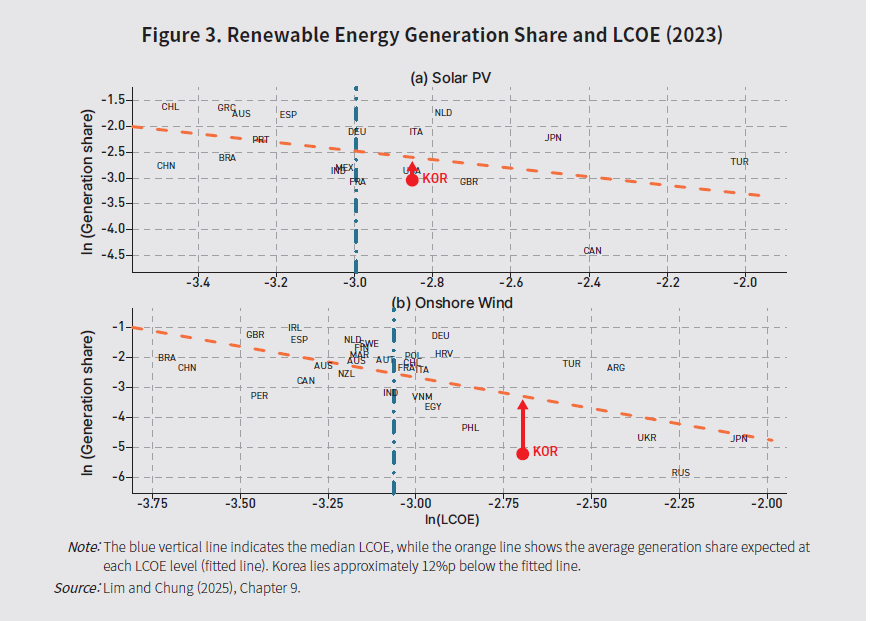
High generation costs are the perceived culprit behind slow deployment of renewable energy in Korea. As Figure 3 shows, Korea’s levelized cost of electricity (LCOE)—the unit cost calculated by dividing the construction and operating costs of a generation facility by its total output—is relatively high among major economies. This reflects unfavorable solar and wind resource endowments, combined with the burdens of land acquisition, permitting, and local acceptance. Figure 3, however, reveals a more nuanced reality: Korea’s actual renewable generation shares (the red dots) sit below the expected averages for countries at comparable LCOE levels (the fitted lines), indicating that non-cost barriers further impede deployment.
Even after accounting for high generation costs, Korea’s renewable deployment remains relatively low, pointing to non-cost structural barriers.
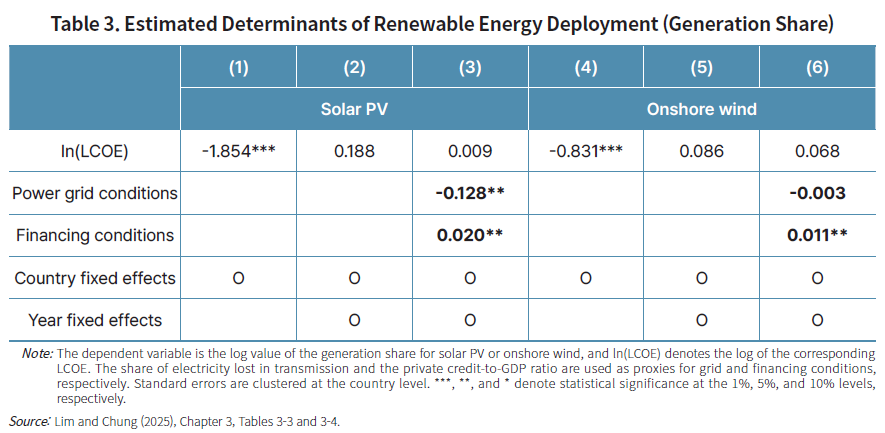
To identify the drivers of this non-LCOE gap, this study examines cross-country panel data to empirically analyze the determinants of renewable energy deployment. In addition to generation cost (LCOE), the main explanatory variables are grid conditions (network quality and flexibility) and financing conditions (private credit and foreign investment). More direct indicators of power grid and finance, such as interconnection queues, curtailment rates, or the maturity of power purchase agreement (PPA) markets, would be preferable, but comparable cross-country data are unavailable. The analysis therefore adopts internationally comparable proxies, namely the share of electricity lost in transmission and the ratio of private credit to GDP. Control variables include oil rents as a share of GDP, ln(GDP per capita), the manufacturing share, and the energy import share. As columns (1) and (4) of Table 3 show, countries with lower LCOE tend to have higher deployment shares, but the relationship disappears once year fixed effects are included to control for common global trends of falling LCOE and rising deployment. By contrast, when grid and financing conditions are added (columns (3) and (6)), both enter significantly. This suggests that even among countries with similar generation costs, more favorable grid and financing conditions are associated with higher renewable generation shares.
Cross-country panel analysis shows that better grid and financing conditions lead to higher renewable deployment rates.
How does Korea fare across these two dimensions? Structural weaknesses are observed in both grid infrastructure and financing. The first bottleneck lies within the power grid. Renewable power generation is prone to temporal mismatch with the demand profile— solar output peaks around midday while wind generation depends on weather conditions. In Korea, this temporal challenge is paired with a spatial mismatch between the southern and southwestern coasts, where renewable resources are more favorable, and the Seoul metropolitan area, where most electricity is consumed. When such misaligned output exceeds the grid’s capacity to transmit or absorb it, power production from renewables and other generators is curtailed in line with system operating standards to maintain stability. Addressing these mismatches requires both expanding the transmission network and securing distributed energy and flexibility resources that can bridge gaps in time and location. Korea currently falls short on both fronts.
In Korea, the transmission network has not kept pace with the growth of renewable capacity, and market arrangements to bridge supply–demand gaps remain underdeveloped, resulting in repeated instances where power cannot be delivered when needed.
Transmission infrastructure has not kept up with the growth of generating capacity. Between 2003 and 2023, generation capacity grew by 154% while the transmission network expanded by only 26%. This is the result of recurrent delays in transmission line projects during siting, community acceptance, and permitting, even as generation capacity continued to increase. Only recently have limited new interconnections been allowed in grid-saturated regions, such as Honam and Jeju, where new connections had been restricted until 2031. Similarly, conditions for distributed energy and flexibility resources—such as Energy Storage Systems (ESS) and demand response—remain inadequate to close the supply–demand gap. Distributed energy reduces transmission burdens by generating power close to where it is consumed. While the legal foundation is in place, price signals to incentivize it—such as locational pricing and regional differentiated tariffs—are not yet operational. Flexibility resources can also balance supply and demand by absorbing surplus power at midday and returning it when supply is short, but the markets needed to compensate such services at a fair price are still immature.
The second bottleneck is access to finance. Revenue predictability is a key factor in mobilizing capital. Under the current framework, the revenues of renewable power producers depend on system marginal prices (SMP) and REC prices, both of which are highly volatile and make future earnings difficult to project. Mechanisms that provide stable, long-term revenues to absorb this volatility are also scarce. One such outlet is the fixed-price contract auction run by the Korea Energy Agency. Because the ceiling price set by the agency has fallen short of rising project costs and expected spot-market revenue, these auctions have been undersubscribed round after round. Another option, direct PPAs with corporate buyers, has yet to fully take off due to restrictions on the scope of counterparties and transaction volumes. Consequently, power producers are left exposed to market volatility without secure long-term revenue streams, pushing up their cost of capital. In addition, projects such as offshore wind and utility-scale ESSs that require large-scale, long-term financing backed solely by project revenues face constrained capital supply. This is compounded by the limited experience of domestic financial institutions with non-recourse lending and the relatively small pool of available policy finance.
Limited access to stable long-term revenue streams and insufficient financing capacity make it structurally difficult to attract investment into renewable energy projects.
The two bottlenecks feed into each other. When grid congestion triggers curtailment and connection delays, power producers sell less electricity, making revenue forecasting harder. Financial institutions price the resulting cash-flow uncertainty into a higher risk premium, raising the cost of capital. Put briefly, the grid bottleneck itself becomes a pathway that deepens the capital bottleneck. Furthermore, as renewable deployment expands, more capacity crowds onto the same grid. This leads to more frequent and severe exceedances of hosting capacity limits during hours of concentrated renewable output, causing the grid bottleneck to worsen faster than the pace of deployment expansion. The trend is already observable today, even with variable renewables at only 6.6% of national electricity generation.
Creating a vicious cycle, the two bottlenecks risk slowing renewable deployment and undermining subsidy cost-effectiveness.
If both bottlenecks intensify alongside accelerating renewable deployment, the previously estimated benefit per won of subsidy can hardly be sustained. More frequent curtailment reduces electricity sales, which lowers the expected return on investment and dampens new investment that subsidies are meant to attract. Tighter access to capital likewise makes it harder for power producers to respond to price signals, which reduces supply elasticity. In effect, both channels weaken the virtuous circle between learning-by-doing and supply elasticity that underpins the benefit per won of subsidy. Expanding deployment while leaving the bottlenecks unchecked erodes subsidy efficiency.
IV. An Integrated Policy Framework for Scaling Renewables
Figure 4 incorporates the findings from Section III into the deployment process introduced in Figure 2. At the initial stage of installation and generation, the binding constraint is capital mobilization, characterized by both a shortage of stable revenue outlets and inadequate financing structures and capital resources for large-scale, long-term lending. Moving to the grid and transmission stage, grid infrastructure becomes the constraint: transmission grid shortfalls trigger connection delays and curtailment, compounded by a lack of flexibility resources to buffer temporal and spatial mismatches in supply and demand. Finally, at the sales and revenue stage, deployment support—primarily subsidies—underpins project revenues, and cost-effectiveness varies sharply with how that support is designed.
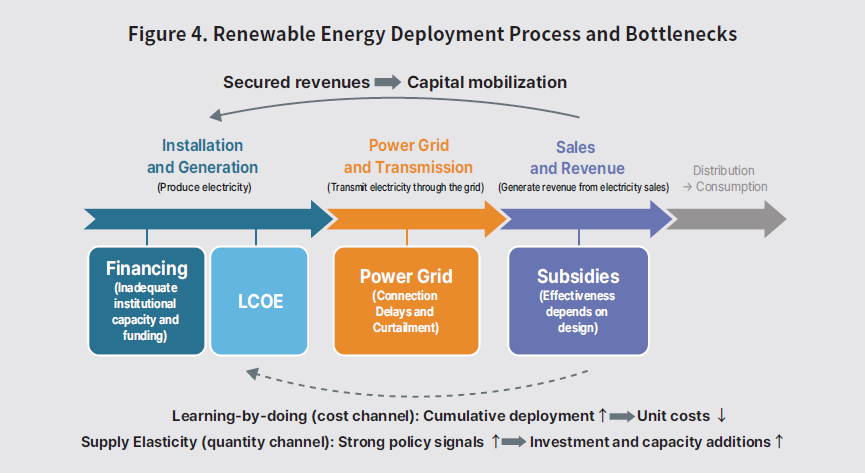
Because these stages form an interlinked chain, a shortfall at any stage commensurately slows overall deployment. Besides, conditions at each stage directly shape the performance of the others and the cost-effectiveness of policy support. The greater the revenue certainty achieved at the sales stage, the more effectively capital can be mobilized at the installation stage; the more cumulative capacity expands, the further learning effects drive down generation costs; and the clearer the policy signals, the more responsively investors react (supply elasticity). Likewise, a stable deployment support system is a prerequisite to incentivize domestic financial institutions to build their renewable project finance capabilities. Although the government is broadening the policy foundations through support reform, grid expansion, and policy finance scale-up, a siloed implementation strategy curbs their overall efficacy. The core tasks for each pillar are detailed below.
Only with all three pillars—grid infrastructure, financing, and deployment support—in place can Korea improve both the pace and efficiency of renewable energy deployment.
First, the power grid requires a balanced integration of physical capacity and market foundations. As the physical prerequisite for the other two, grid infrastructure is the most urgent of the three pillars: a bottleneck here leaves financing and deployment support ineffective, even when those mechanisms function as intended. On the physical front, expanding the transmission network is the primary imperative. Because transmission projects take more than a decade from site selection to commissioning, physical hosting capacity must be expanded swiftly by clearing the institutional and social obstacles to construction and ensuring alignment between renewable buildout and grid expansion. At the same time, the market side calls for a foundational architecture for distributed energy and flexibility resources capable of bridging supply–demand mismatches. While regional differentiated tariffs can steer demand and distributed generation toward areas with better grid conditions, properly compensating ESS and demand response for their diurnal balancing services allows the private sector to stabilize supply and demand autonomously, thereby easing the system burden until transmission infrastructure catches up. With relevant legal and institutional frameworks recently beginning to take shape across both fronts, the test now is effective implementation to ensure practical functionality.
Timely expansion of transmission capacity and flexibility resources is needed to reduce curtailment and connection delays. Long-term contracting arrangements, policy finance expansion, and more diverse revenue channels are also required to improve revenue predictability.
Second, to ease the financing bottleneck, project revenue risk should be reduced while simultaneously building the structural framework and financial resources for long-term capital at scale. On revenue, the existing auction-based long-term contracts need to be established as an effective offtake channel for power producers to reduce revenue volatility. Easing restrictions on PPA counterparties and transaction volumes would introduce corporate procurement as an additional revenue stream, providing producers with a broader portfolio of stable returns. On the supply side of finance, large-scale, long-tenor project financing needs to take root. When policy finance institutions anchor large-scale projects and take on the high-risk tranches that private lenders avoid, private capital can be crowded in, also allowing commercial banks to build project appraisal expertise.
Subsidy policy should be designed to reinforce the virtuous cycle between learning-by-doing and supply elasticity, with regular cost–benefit evaluation to maintain long-term policy support efficiency.
Third, renewable deployment support should be designed to drive the virtuous cycle between learning-by-doing and supply elasticity, with its cost-effectiveness periodically assessed and adjusted. On design, contracts for difference (CfDs) are under consideration as the settlement mechanism for competitive bidding-based long-term contracts. Given that both RPS-REC and auction-based CfDs perform a similar subsidy function, the cost-benefit findings from Section II should inform CfD design. Specifically, policy predictability can be enhanced by announcing multi-year auction volumes in advance, prioritizing sites where grid connection and permitting are already secured, and publishing pricing and evaluation rules beforehand. Collectively, these measures will drive investment, accelerate learning-by-doing, and improve supply elasticity. On review and adjustment, support levels and durations should be calibrated to technological maturity and project conditions, with costs and benefits regularly assessed and disclosed to ensure that resources are prioritized for the most efficient projects and technologies.
Korea’s renewable energy policy stands at a turning point. The deployment framework is shifting from the RPS to competitive auctions, and the rules governing the power grid, distributed energy, and electricity markets are being realigned to support the growing share of renewables. In its recent announcement of the Three Mega-Projects, the government reaffirmed key measures to build a stable electricity supply for advanced strategic industries—including the expansion of flexibility resources like battery energy storage systems (BESSs), the introduction of regional differentiated tariffs, a dedicated trading platform linking renewable generators with corporate buyers, and the development of virtual power plants (VPPs). For this transition to translate into deployment that is both swift and cost-effective, isolated reform on any single axis will not be enough. Designing an efficient and predictable support scheme must go hand in hand with dismantling the bottlenecks in grid infrastructure and financing. Only when all three pillars advance in unison can renewable deployment accelerate at lower cost.
- CONTENTS
-
- I. Background
- II. Cost–Benefit Analysis of Renewable Energy Subsidies
- III. Structural Constraints on Renewable Deployment
- IV. An Integrated Policy Framework for Scaling Renewables
- Key related materials
We reject unauthorized collection of email addresses posted on our website by using email address collecting programs or other technical devices. To access the email address, please type in the characters exactly as they appear in the box below.
Please enter the security code to prevent unauthorized information collection.