
KDI FOCUS Rebuilding Scale-up Support Policies: Toward an Integrated Framework March 24, 2026
Rebuilding Scale-up Support Policies: Toward an Integrated Framework
March 24, 2026-
Minho Kim
 프로필
프로필

 As firms rapidly lose dynamism beyond the early stage, resolving their growth bottlenecks has emerged as a critical policy priority. Empirical analysis shows that successful scale-up is closely tied to R&D investment, AI adoption, and exports in manufacturing, whereas brand strength and design capabilities are key drivers in services. This highlights the limitations of single-track, R&D-centric support and the greater effectiveness of coordinated policy mixes based on firm-specific growth bottlenecks. Achieving this requires pivoting toward a more effective model―one that brings scale-up programs under integrated management and overhauls the performance evaluation framework.
Ⅰ. Decline in High-Growth Firm Activity
The success of economic growth strategies hinges on whether firms achieve substantive growth. While recent rallies in the KOSPI and other capital market indicators are encouraging, the concentration of these benefits among a few large-cap bellwethers makes it premature to conclude that firm growth has broadly recovered. The data tell a clear story: across both manufacturing and services, the share of low-growth firms is rising, and the share of high-growth firms (HGFs) is declining (Appendix). What is troubling is that this slowdown is spreading across the entire business sector, dampening activity even among firms at the scale-up stage—precisely those expected to expand through innovation and investment. Reversing this low-growth trajectory will require more than the current policy toolkit can deliver.
The core of an economic growth strategy lies in firm growth, yet business dynamism in Korea has weakened markedly.
Low growth and declining business dynamism are not challenges unique to Korea. Major advanced economies are stepping up efforts to cultivate new drivers of growth amid the digital transition and an intensifying global contest for technological leadership. Increasingly, scale-up policy aimed at identifying and nurturing firms with strong growth potential has emerged as a key part of the answer. Scaleup firms are those that have progressed beyond the early start-up stage and are pursuing expansion through investment in innovation, overseas market entry, and workforce growth. When these efforts lead to rapid gains in revenue or employment, such firms are classified as high-growth firms (HGFs). As engines of growth, HGFs create jobs, stimulate innovation within industries, and improve resource allocation across the economy.1) The European Union (EU) has made scale-up support a strategic priority, channeling support for innovative scale-ups through the European Innovation Council (EIC). Research by the OECD (2021) and other studies shows that a small cohort of HGFs accounts for a remarkably large share of job creation and economic expansion.
While HGFs are key drivers of growth and job creation, their share in the Korean economy is declining, with scaleup firms showing a sharp contraction in activity.
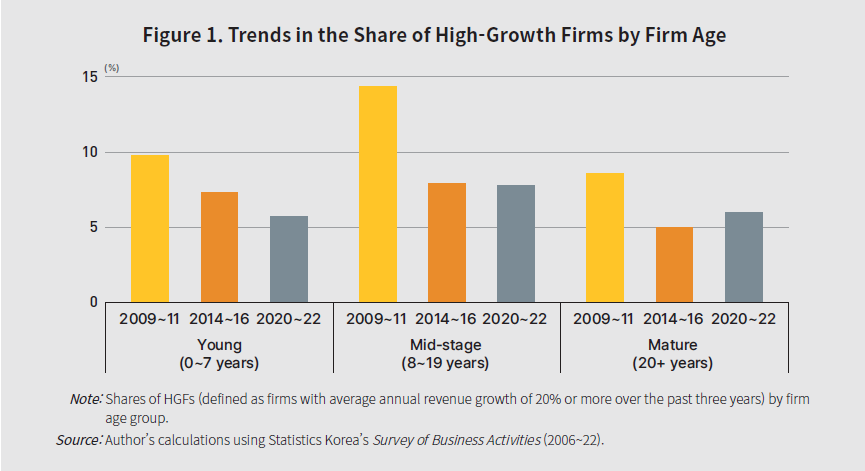
This study defines HGFs as firms with average annual revenue growth of 20% or more over a three-year period. Using Statistics Korea’s Survey of Business Activities, it finds that HGFs account for roughly 50% of total annual revenue growth and 38% of job creation across the Korean economy, underscoring their outsized economic contribution.2)3) Starting from a small base, these firms expand rapidly and catalyze dynamism across the broader economy. A notable finding is the presence of a distinct growth stagnation phase in the firm lifecycle. Breaking down the data by firm age reveals that the erosion of dynamism is more pronounced among mid-stage firms (8-19 years)—the cohort that should be entering a full-scale growth trajectory—than among young firms (0-7 years) (Figure 1). The share of HGFs among mid-stage firms fell sharply from an average of 14.4% in 2009-11 to 7.8% in 2020-22. The implication is that firms are either failing to build the necessary capabilities to transition from start-up to scale-up, or those entering maturity are not adapting effectively to global competition and rapid technological change.
Turning the government’s growth strategy into concrete action is emerging as a key priority.
Reviving dynamism in the Korean economy requires an environment in which high-potential firms can successfully scale up into HGFs. Achieving this means both identifying the drivers of firm growth and realigning the policy support framework. This study takes up both tasks: it examines the role and growth drivers of scale-up firms and sets out practical policy measures spanning the full cycle of scale-up policy design, implementation, and evaluation.
Ⅱ. HGF Activity and Industry Productivity Growth
Before turning to scale-up support policies, it is worth examining how HGF activity relates to aggregate productivity across the economy. From a resource allocation perspective, aggregate productivity tends to improve when more productive firms scale up and draw a greater share of resources (labor and capital). The expansion of HGFs, however, may yield varying outcomes depending on intra-industry competition structures and how competing firms respond. This section employs industry-level panel regressions to assess the statistical associations—not causal—between the share of HGFs and aggregate productivity growth.
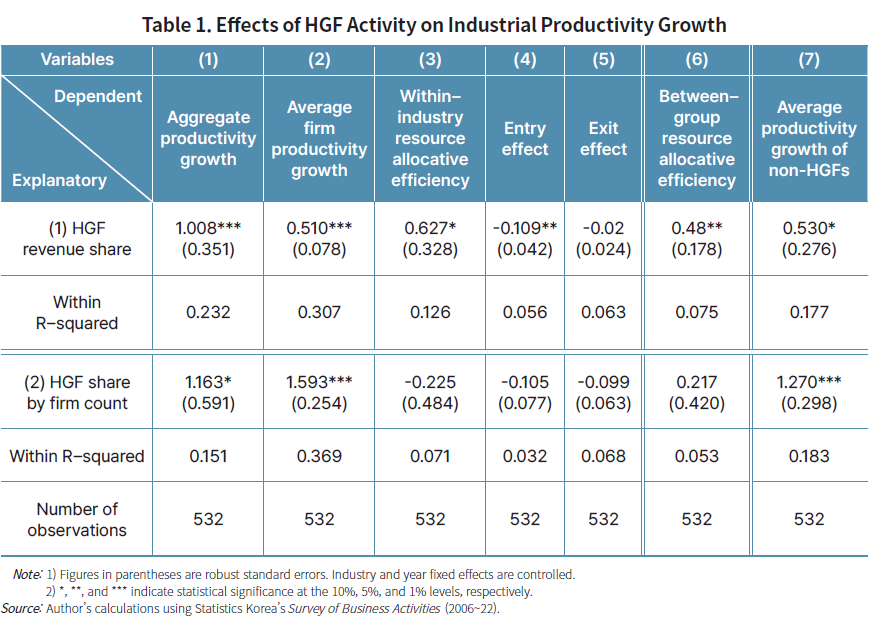
To this end, aggregate industry productivity is defined by aggregating firm-level productivity within each industry. Employing a dynamic Olley-Pakes productivity decomposition, aggregate productivity growth is decomposed into four components: changes in average firm productivity, changes in within-industry allocative efficiency, entry effects, and exit effects. Changes in average firm productivity capture how the average productivity of surviving firms evolves over time. Changes in within-industry allocative efficiency reflect the extent to which industry productivity improves as production factors are reallocated toward more productive firms. Entry and exit effects measure the respective contributions of new entrants and exiting firms to changes in average industry productivity. Aggregate industry productivity growth is further decomposed by distinguishing HGFs from non-HGFs, enabling an assessment of changes in between-group allocative efficiency. Finally, each component is used as a dependent variable to estimate how two indicators of HGF activity—(1) HGF revenue share and (2) HGF share by firm count—are associated with aggregate industry productivity growth.
A higher share of HGFs within an industry is positively and significantly associated with aggregate productivity growth, accompanied by improvements in average firm productivity and allocative efficiency.
A 1%p increase in the revenue share of HGFs within an industry is associated with approximately a 1%p increase in aggregate industry productivity growth.5) This relationship can be attributed to the combined contribution of (i) improvements in average firm productivity (0.5%p) and (ii) gains in within-industry allocative efficiency (0.6%p) (Table 1, columns (1)-(5)). As resources are increasingly channeled toward the relatively more productive group of HGFs, a statistically significant association is also observed with improvements in between-group allocative efficiency (Table 1, column (6))
To examine the relationship between HGF activity and non-HGF productivity, the analysis restricts the sample to non-HGFs and finds that industries with a higher HGF share tend to exhibit higher average productivity growth among them as well (Table 1, column (7)). Meanwhile, the correlation between the HGF share by firm count and aggregate industry productivity growth is estimated to be even stronger, with a higher HGF share associated with faster growth in average industry productivity.
Given the recent decline in HGF activity, the potential link to the slowdown in industry productivity growth warrants close examination.
Taken together, the share of HGFs within an industry is positively and significantly associated with aggregate industry productivity growth—an association that is observed alongside improvements in average firm productivity and gains in allocative efficiency. These findings underscore the potential for HGFs to drive industry-level productivity. They also underscore the need to examine whether the recent decline in the HGF share is associated with a weakening of productivity-enhancing mechanisms, including changes in average industry productivity and improvements in allocative efficiency.
III. Drivers of High Growth
The entry and expansion of firms with exceptional growth potential are central to both economic growth and productivity gains at the industry level. Their declining share makes it a priority for both policymakers and firms to understand what propels these firms to scale, and to design effective strategies and support instruments accordingly.
To identify the factors influencing the probability of a firm transitioning into an HGF, this section uses panel logit regression analysis. The dependent variable is a binary indicator of whether a firm qualifies as an HGF three years later, while explanatory variables include firm size and age, along with indicators capturing productivity, innovation, and investment activity.
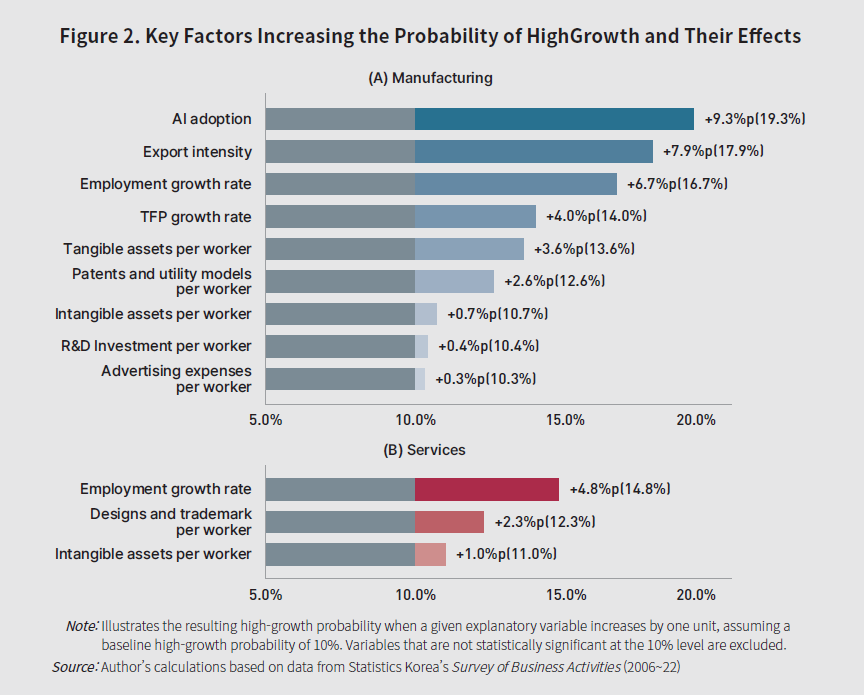
The empirical results indicate that, in manufacturing, the probability of achieving high growth is closely linked to productivity gains and engagement in innovation- and knowledge-driven activities. Specifically, higher growth rates in both total factor productivity (TFP) and employment, investment in intangible assets and R&D, and patent holdings all significantly raise the likelihood of high-growth transitions. Active export engagement and AI adoption are also positively associated with high-growth outcomes. Figure 2 presents these factors and shows how the high-growth probability changes with a one-unit increase in each, assuming a baseline of 10%. For instance, a firm with a baseline high-growth probability of 10% that records a 1%p increase in its TFP growth rate would see that probability rise by approximately 4%p, to 14%.
Effective scale-up policy requires a solid grasp of what drives firms to achieve high growth.
R&D investment per worker also has a statistically significant positive effect, but its magnitude is relatively modest (0.4%p). This should not be read as diminishing the value of R&D investment. Rather, R&D is best understood as a more readily actionable policy lever than TFP improvement, and its contribution to high-growth transition may be greater when combined with complementary factors such as workforce and organizational capabilities, export and market expansion, and AI adoption.
The service sector, however, exhibits a distinct set of growth drivers. Alongside employment expansion, greater intangible assets per worker, and the ownership of design and trademark rights significantly raise the probability of high growth. This suggests that in services, beyond product and process innovation, intangible assets such as brand strength, design capability, and customer experience play a major role in market expansion and demand creation. These results do not imply that productivity is of lesser importance in the service sector. The AI adoption variable was only added to surveys in 2017, which limits the sample period. Utilizing data from 2006, after excluding this variable, TFP also emerges as a key determinant of high growth in the service sector. In other words, productivity and intangible assets likely operate as complements rather than substitutes—suggesting a structure in which productivity improvement lays the foundation for firm growth, while intangible assets support high-growth transitions through market differentiation and expansion.
The broader policy implication is that growth support policies should reflect industry-specific characteristics. In manufacturing, strengthening innovation capabilities, including technological development, process improvements, R&D, and investment in intangible assets, is highly likely to translate into high growth. Policy instruments that promote the accumulation of technology and knowledge can therefore be relatively effective. In the services sector, by comparison, high growth is more strongly linked to intangible assets geared toward market expansion, such as brand development, customer experience enhancement, and design and marketing capabilities. Policy should also move beyond a single, R&D-centric instrument to adopt integrated support packages tailored to firm- and industry-level characteristics.
Productivity improvement is a key driver of high growth, but the factors at work differ across industries. Reliance on a single instrument such as R&D support risks limiting overall policy effectiveness.
The current support framework, however, does not fully incorporate these key growth drivers, particularly productivity improvement. Because capital injection alone is insufficient to systematically strengthen firm productivity and capabilities, policy support needs to shift toward a performance-oriented framework. To achieve this, support programs should be designed to generate measurable outcomes across the key growth drivers—productivity improvement, innovation outcomes (patents and intangible assets), and export and market expansion—and create stronger incentives for firms to invest in these areas.
Ⅳ. Policy Directions for Strengthening Scale-up Support
Scale-up firms contribute substantially to economic growth, job creation, and aggregate industry productivity—making a stronger support framework a central priority in overcoming low growth. What matters most, however, is not creating more programs. The real gains in policy effectiveness lie in improving how existing initiatives are combined and deployed.
The system should shift to a one-stop model that identifies growth bottlenecks before firms apply for individual programs and rapidly designs, integrates, and delivers the most effective combination of existing policy instruments and private-sector services
1. Innovating the Support System: A One-stop Diagnostic Framework for Rapid Delivery through Policy Packaging and Private-sector Engagement
Rather than relying on fixed criteria or instruments such as firm age or R&D, growth support policy should shift toward a framework that identifies firm-specific growth bottlenecks and combines existing policy instruments into the most effective mix. Given that HGFs appear in relatively high proportions not only among young firms but also among mid-stage firms (8-19 years), confining support primarily to young firms may limit overall effectiveness.
This proposal does not aim to create new programs tailored to individual growth factors. Instead, it establishes an operational framework that, before firms search for and apply to individual programs (e.g., R&D, international expansion, workforce development, or data and AI), first designs the most effective combination of existing policy instruments and then coordinates their rapid delivery across government agencies. In short, the goal is to reframe program-byprogram support with a one-stop integrated package model.
Operationally, the government should standardize a single-application, single-diagnostic, multiple-instrument framework. A firm simply submits one application and undergoes a diagnostic assessment. The government then uses the findings to identify the firm’s specific growth bottlenecks—such as productivity, workforce, intangible assets, overseas market access, financing, and digital transformation—and packages existing support programs into an optimal combination.
The model operates in three stages:
(1) One-stop diagnostics: Firm-specific growth bottlenecks are identified by combining quantitative data (financials, growth, productivity, exports, workforce, intangible assets, and digital adoption) with management interviews and on-site assessments.
(2) Policy package design: Existing support instruments—including R&D, process and service upgrades, international expansion, workforce and organizational capabilities, intangible assets (branding, design, and trademarks), AI and data transformation, and financing (guarantees, loans, and investment linkages)—are assembled into an optimal firm-specific combination.
(3) Execution through private-sector engagement: Firms are matched with private-sector service providers, with follow-up support delivered in stages upon meeting predefined performance milestones.
Private-sector engagement should be voluntary by default. Direct public support through vouchers or performance-linked mechanisms is warranted only in cases of market failures or urgent needs, with provider evaluation in place to control quality and guard against moral hazard.
The diagnostic rests on two core components. The first distinguishes between constraints that firms are already aware of (funding shortfalls and labor shortages) and latent organizational bottlenecks not yet recognized (productivity stagnation, underutilized intangible assets, and delayed digital transformation). Identifying the unrecognized requires benchmarking quantitative data on financials, growth, exports, and workforce against peer firms, supplemented by management interviews and on-site assessments to surface capability gaps that observable metrics alone cannot capture. The second elevates the diagnosis beyond a list of deficiencies to present a visible growth trajectory, illustrating how revenue, exports, and productivity are likely to improve as specific bottlenecks are addressed. Making the link between bottleneck resolution and scale-up clear is essential for securing firm buy-in and guiding the design of subsequent policy packages.
Private-sector engagement should not rely on upfront government funding. In principle, firms engage private-sector service providers on their own initiative based on their diagnostic results. Direct public support, such as vouchers or matching schemes, is warranted only where market failures (information asymmetries, high initial fixed costs, or externalities) prevent independent access, or where urgent intervention is required.
Firms with urgent growth bottlenecks should be placed onthe Fast Track, withsimplified procedures and prioritized access to private-sector services.
Firm-level support should be differentiated by execution speed and urgency. Firms whose outcomes are time-sensitive, such as export contracts, certifications, or delivery deadlines, should be placed on the Fast Track, with simplified procedures and prioritized access to immediately deployable private-sector services (overseas regulatory compliance and certification, logistics and customs clearance, local partner matching, and short-term workforce placement). Conversely, firms requiring mid- to long-term improvements in productivity or organizational capabilities are better served by the Program Track, where public and private support are combined in stages based on predefined milestones.
To guard against moral hazard and service quality deterioration in private-sector engagement, providers should operate within a management framework that enables registration, performance evaluation, and delisting. This framework should institutionalize the following: (i) standardized contracts with clearly specified key performance indicators (KPIs); (ii) performance-linked compensation (partial deferral and outcome-based payments); (iii) multidimensional evaluation incorporating firm satisfaction, reengagement rates, and performance achievement; and (iv) penalty mechanisms (registration restrictions and delisting) for underper-forming providers. Voucher disbursements should follow phased, performance-contingent payments rather than a full upfront settlement, preventing cost pass-through and superficial service delivery.
Operationalizing a one-stop support system requires a central entity to coordinate and manage programs across ministries. One approach worth considering is assigning this overarching coordination role to the Ministry of SMEs and Startups (MSS). As the lead ministry for small and mediumsized enterprises (SMEs) and scale-up policy, the MSS has direct engagement with firms and extensive operational experience, making it a natural hub for diagnostics, policy package design, and post-support management. Firm-level diagnostics, package design, and delivery could be entrusted to specialized agencies such as the Korea SMEs and Startups Agency (KOSME). The role of driving cross-government coordination through fiscal incentives and governance mechanisms could, for example, fall to the Ministry of Finance and Economy (MOFE). The responsible ministry would be tasked with classifying scaleup programs, standardizing common KPIs, streamlining overlapping initiatives, introducing performance-based budget allocation, and building the data infrastructure needed to make a single-application,multiministerial system function in practice.
With the one-stop system in place, firms are relieved of the burden of searching for individual support programs, while the government is equipped to operate an integrated single-application, multiministerial linkage system that prevents duplicate applications across ministries and local governments. This approach is effective in that it (i) reduces fragmentation and overlap across support instruments, (ii) lowers search and application costs for firms, and (iii) allows policy resources to be more effectively directed toward actual growth bottlenecks. Publicly disclosing standardized diagnostic and performance evaluation frameworks would also foster competitive pressure around quality and specialization among private service providers, supporting the development of a more robust market for corporate support services.
Furthermore, this transition would help address the current concentration of scale-up support on R&D. As the analysis in Section III shows, per-worker R&D expenditure is not consistently associated with high growth in the service sector, and an R&D-slanted structure risks concentrating support in a narrow set of technology-intensive industries. A one-stop integrated package model would enable the support framework to evolve into a relationship-oriented support model that aligns resources and expertise with the diverse growth constraints firms face, including productivity improvement, investment in intangible assets, and foreign market access. Scale-up support in many advanced economies is built around specialized advisory services and network-based engagements.7) In Korea, building on the bespoke model proposed by Kim (2023), the MSS has introduced the Jump-Up Program to support high-potential SMEs in their transition to mid-sized enterprises. The core of this proposal, however, goes beyond individual programs. It calls for overhauling the very way policy operates into a one-stop integrated framework.
2. Clarifying Scale-up Support Policies and Strengthening the Performance Management Framework
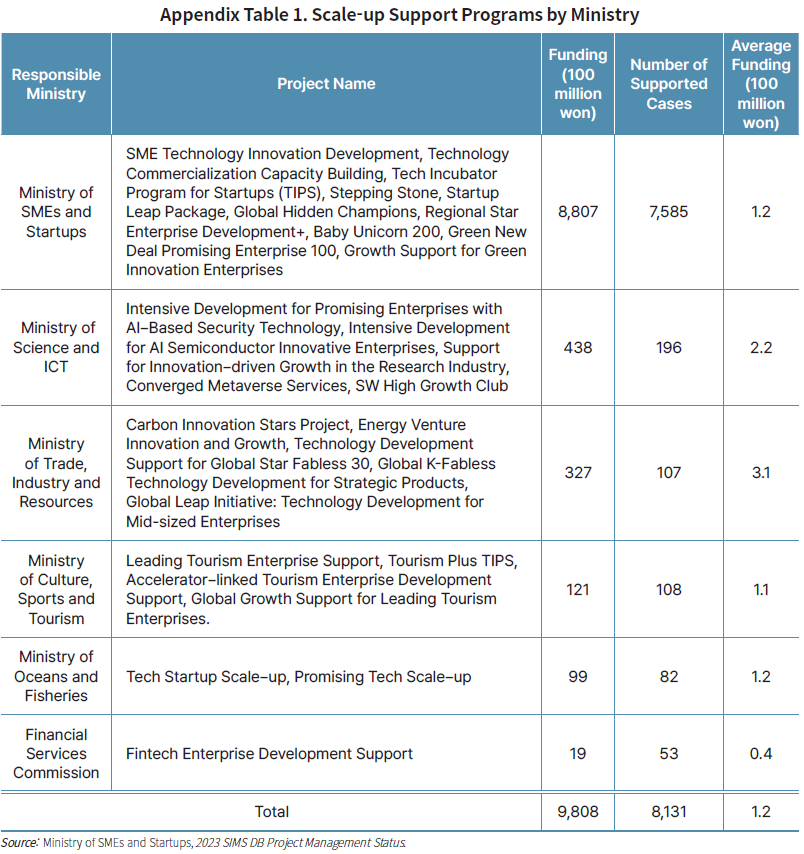
Scale-up support programs should be evaluated in terms of tangible improvements in firm capabilities, such as productivity growth, while strengthening the link between policy inputs and outcomes. To this end, the government should define and classify programs with explicit scale-up objectives, bring them under integrated management, consolidate performance data at the program level, and reflect the results in subsequent budget allocations.
The government should streamline and integrate the management of scale-up support programs and establish a performance management framework linked to tangible firm growth and capability development.
As is currently the case, without a dedicated management framework for scale-up programs, overlap and fragmentation across similar initiatives will accumulate, raising search and application costs for firms. To identify scale-up support programs,
The analysis of high-growth determinants suggests that activities related to knowledge capital—productivity improvement, human capital acquisition, and investment in intangible assets—are key drivers. Instead of focusing narrowly on the number of supported firms or total funding disbursed, performance indicators should incorporate both growth indicators (revenue, employment, export, and investment) and capability metrics (productivity gains, intangible assets accumulation, data and AI adoption, key talent retention and turnover, and new market entry). Since average metrics are highly susceptible to distortion by the exceptional performance of a small number of firms, supplementary effectiveness measures, such as the share of supported firms exceeding the industry-average growth rate, should be introduced for more accurate monitoring across all supported firms.
Clearly distinguishing scale-up programs from the broader terrain of firm support initiatives and structuring performance indicators around growth and capability metrics is the necessary first step toward filtering out low-impact programs and directing resources toward firms that generate genuine growth.
Appendix
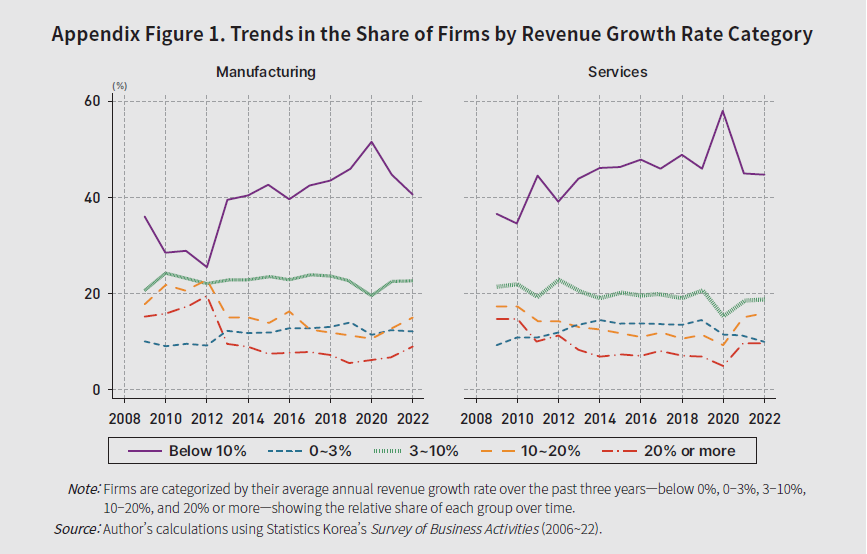
Using data from Statistics Korea’s Survey of Business Activities, firms are classified by their average annual revenue growth over the past three years. The results show that, in both manufacturing and services, the share of firms experiencing negative growth (below 0%) has increased, while the share achieving growth of 10% or more has declined (Appendix Figure 1). The share of HGFs (growth exceeding 20%) fell sharply from 2009 to 2020 and, despite a partial recovery in 2022, remains well below its 2009 level.
- CONTENTS
-
- I. Decline in High-Growth Firm Activity
- II. HGF Activity and Industry Productivity Growth
- III. Drivers of High Growth
- IV. Policy Directions for Strengthening Scale-up Support
- Appendix
- Key related materials
We reject unauthorized collection of email addresses posted on our website by using email address collecting programs or other technical devices. To access the email address, please type in the characters exactly as they appear in the box below.
Please enter the security code to prevent unauthorized information collection.